In today’s data-driven world, making informed decisions has never been more critical, especially when it comes to addressing the urgent issue of carbon emissions. Our firm has taken a significant step in this direction by creating a carbon emissions calculator report using Power BI, a powerful data visualization tool. In this blog post, we’ll take you on a journey through the significance of this report, demonstrating how it can empower businesses to make better data-driven decisions that impact not only their bottom line but the planet as well.
A Closer Look at the Carbon Emissions Calculator Report
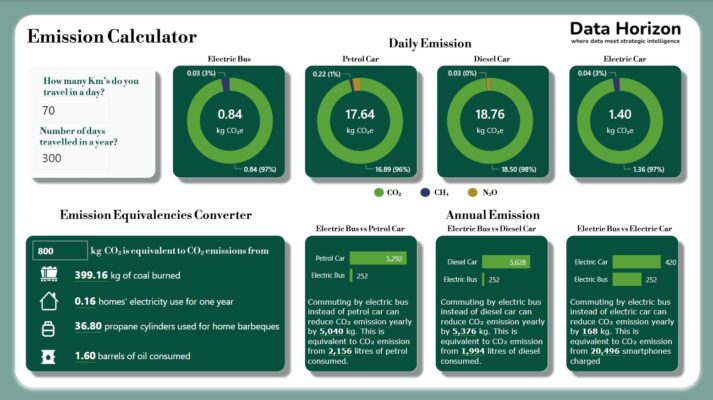
Our carbon emissions calculator report doesn’t just provide data; it offers a unique perspective on carbon emissions associated with daily commutes. Whether you’re using an electric bus, a petrol car, a diesel car, or an electric car, the report showcases the environmental impact of your choices. We break it down by daily and annual emissions, making it simple for users to understand their contribution to carbon emissions.
The Importance of Understanding Carbon Emissions
Why is it important for businesses and individuals to understand their carbon emissions? The answer lies in the growing global concern over climate change. By quantifying carbon emissions in a clear and accessible way, our report empowers individuals and organizations to take responsibility for their environmental impact.
Empowering Data-Driven Decisions
One of the main objectives of our carbon emissions calculator report is to drive data-driven decisions. We believe that when you have access to valuable information in an easily digestible format, you’re more likely to take action. Whether you’re a business owner, an employee, or a concerned citizen, this report arms you with the knowledge needed to make environmentally conscious choices.
Our carbon emissions calculator report in Power BI isn’t just about data; it’s about transforming numbers into actionable insights. By discussing its importance, we aim to inspire individuals and businesses to make sustainable choices and embrace a data-driven future.
Download Your Insights
We believe in the power of data to drive positive change. If you’re interested in exploring the insights provided by our carbon emissions calculator report in Power BI, you can access and download the report via the following link: Download the Carbon Emissions Calculator Report.
We encourage you to take a closer look at the data, explore the visualizations, and use it as a valuable resource in your journey towards more sustainable decision-making. Remember, knowledge is a catalyst for change, and with this report, you have the tools to make a real difference in the world. Thank you for joining us on this important journey towards a greener and more data-driven future.