Data Visualization: Communicating Insights Effectively
Uncover the art and science of data visualization. Learn how to communicate complex insights effectively for strategic decision-making.
Read More
Unlocking Insights with Data Visualization: A Step-by-Step Guide – Part 1
Explore the foundational concepts and benefits of data visualization. Learn about prerequisites for effective visualizations to drive decision-making and organizational success.
Read More
The Art of Storytelling with Data Visualization
Explore the principles and best practices of storytelling with data visualization. Learn how to engage your audience, drive decisions, and foster collaboration.
Read More
The Data Analytics Revolution: What You Need to Know Now! – Part 2
Delve into the transformative impact of machine learning, AI advancements, data infrastructure & visualization techniques shaping the future of data analytics.
Read More
Common Mistakes in Power BI: Overloading Reports and Optimal Visuals
In the previous post, we discussed the critical importance of data cleansing and transformation in Power BI. Now, let’s explore another common mistake: overloading Power BI reports with unnecessary visuals and elements. We’ll explain why this mistake can hinder report performance and readability and offer tips for optimizing your reports. The Pitfall: Overloading Reports with […]
Read More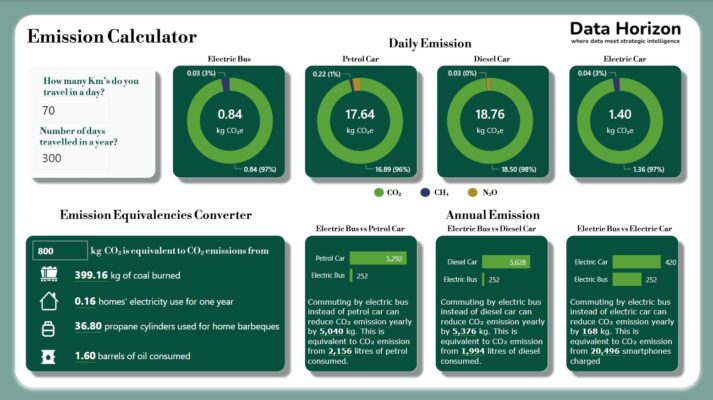
Unlocking the Power of Sustainability: Carbon Emissions Calculator Report in Power BI
In today’s data-driven world, making informed decisions has never been more critical, especially when it comes to addressing the urgent issue of carbon emissions. Our firm has taken a significant step in this direction by creating a carbon emissions calculator report using Power BI, a powerful data visualization tool. In this blog post, we’ll take […]
Read More
Maximizing Efficiency: 10 Essential Power BI Tips and Tricks
Imagine yourself in a data-driven adventure where insights are your treasure, and the map to unlocking them is none other than Microsoft’s Power BI. It’s more than just software; it’s your trusty sidekick in the world of data analysis. With its remarkable blend of user-friendliness and data-wrangling prowess, Power BI is your ticket to turning […]
Read More
Data Visualization Strategies: Unleashing the Power in a Data-Driven World
In today’s rapidly evolving business landscape, data is often hailed as the new oil, and for good reason. With the ever-increasing volume of information at our fingertips, organizations need effective tools to distil complex data into actionable insights. Data visualization, a dynamic and powerful approach, is emerging as a key driver of informed decision-making. Why […]
Read More
Demystifying Predictive Analytics: A Guide for Data Analysts and Scientists
In the ever-evolving landscape of data analytics, predictive analytics stands out as a powerful tool that empowers organizations to anticipate future trends, make informed decisions, and gain a competitive edge. Whether you’re a seasoned data analyst or a budding data scientist, understanding predictive analytics is essential in harnessing the full potential of your data. What […]
Read More